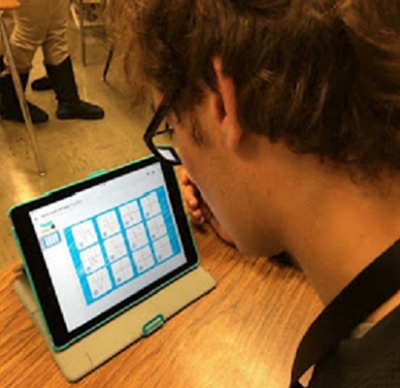
I’ve always held the belief that my students should be able to build a strong foundation of mathematics, not only with paper and pencil, but also with technology. I want them to see the relationship between the task-a-hand; and, the tools needed to complete the task, in the most efficient manner. This week we learned how to plot sets of data, draw trend lines, write the equation for a line of best fit, and use that information to predict from the trend.
Since we live in the sunny state of Florida, known for our oranges, I used the USDA Florida Market Price of Oranges in dollars per box for the price of oranges from 2006 to 2012.
Having been blessed with a class set of TI-84+ calculators, we were set to let technology into our world of learning new skills.
Each year, I try to alleviate some of the anxiety and attempt to comfort my students in the fact that we are “only on a discovery mission and YOU WILL NOT NEED TO KNOW THIS FOR A TEST.” Hoping that all fear is laid aside, we can move forward. Yet, knowing from the past, I’m only fooling myself. Even though I know they will remain paralyzed, I trudge forward every year, determined to place their fearful fingers onto the buttons of the calculator. My hope is to show them the beauty of technology behind the real world around them and the mathematics they can use.
Since I teach my students using Dinah Zike style Foldables (R), they have the guided lesson in front of them with all the keystrokes necessary to succeed, even if they fall behind. I patiently move around the room to get them back on track when they are lost, and never lose my nurturing attitude to help them along. Someone must pave the way if they are to learn to use technology correctly, it might as well be me (and you). I say all of this, knowing it hits a chord with so many of us who do the same thing each year in our classes. Fear Not, Trudge On! I also know for a fact that it’s worth every tedious minute. I teach Pre-Calculus and AP Calculus year-after-year, too. I see the results of showing them the “baby steps” in Algebra 2. It might seem like a wasted effort; but truly, it is not.
If you have never taught linear regression with the TI-84+, here’s a quick rundown on how to proceed.
1. Choose some meaningful linear data to explore.
2. Prior to the lesson you should clear all lists on your calculators. This can be done by pressing
3. Also make sure the Y = graph window is clear.
4. Use L1 for the x-data values and L2 for the y-data values. My Florida oranges information is shown here. I decided to use 1,2,3,4,… to represent the years 2006, 2007, 2008,… since that will keep my view window in a manageable place.
7. The calculator will write the linear regression formula from here. It is important to note that my calculators are using the 2.55 operating system.( You can see your operating system if you click 2nd, then plus sign, then about.) In the screen sot below, notice the Store RegEQ entry line. We need to get our data points to store an equation relate to the x- and y-values into the Y1 window in order to see the trend line. If you have the same operating system, arrow down to this entry line and press the next set of keystrokes. If you have an older version just enter the key strokes below, no need to arrow down.

5. Now activate the STAT PLOT window. You will see the screen below. Be sure the plot is ON, the scatter plot icon is highlighted, and that the list of the X data values are next to Xlist, and the list of the Y data values are next to Ylist. Choose any of the three marks.
Get Your Free Math Resources Today
Join the Flamingo Math Flock to receive news, FREEBIES and updates!
Success! Now check your email to confirm your subscription. We are happy to have you join our Flamingo Math flock! Jean


